Workflow
This chapter describes how to perform QC analysis of alignment data with graphical user interface of Qualimap. To run analysis with command line interface please refer to the corresponding chapter.
Starting a new analysis
- To start new analysis activate main menu item and select the desired type of analysis. Read more about different types of analysis here.

- After the corresponding item is selected a dialog will appear that allows customizing analysis options (input files, algorithm parameters, etc.).
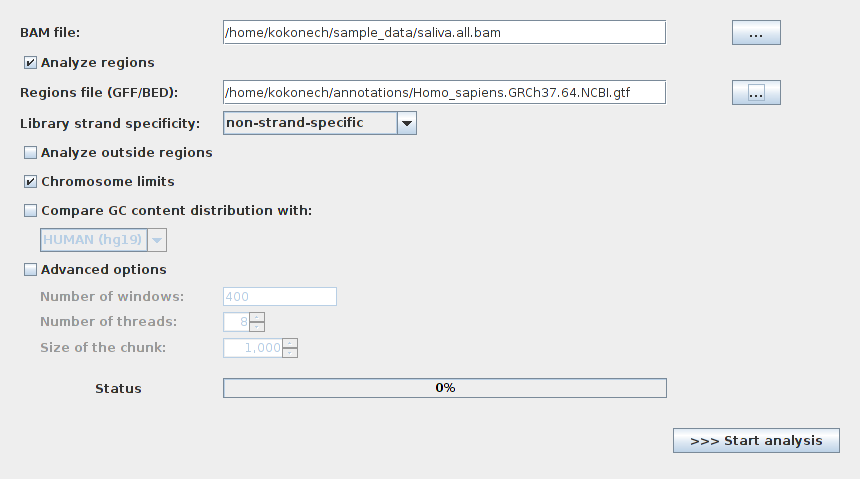
- To run the analysis click the Start analysis button.
- During the computation a status message and a graphic bar will indicate the progress of the computation.
Viewing the results of the analysis
- After the selected analysis is finished the results are shown as an interactive report in the Qualimap main window. Several reports can be opened at the same time in different tabs.
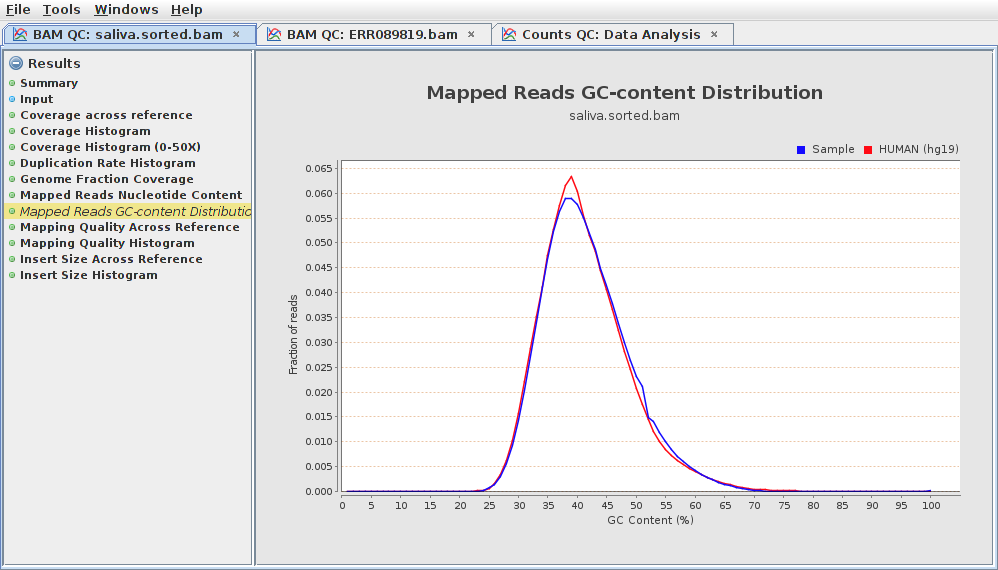
- In the left part of the report window one can find a list containing available result items. Clicking on an item will automatically show the corresponding information report or graph. Some report items are common for different types of analysis.
- For example, the Summary section provides a short summary of performed quality control checks, while the Input section lists all the input parameters. Further information about each specific result is provided here.
Exporting results
- The resulting report along with raw statistics data can be saved to HTML page or PDF document.
- To export results to HTML use a main menu item . In the dialog window one can select the output folder. After clicking OK button the web-page, containing analysis results along with raw statistics data will be saved to the specified directory.
- Similarly one can save the report to a PDF document by using a main menu item .
- Note that for plots in BAM QC and Counts QC it is also possible to export the underlying raw data using the context menu, with appears by clicking the right mouse button in the corresponding plot. In addition, when the report is exported to HTML, the raw data for all plots can be found in the output folder.
Using tools
- Qualimap is desgined to provide NGS-related tools that can be used aside from the quality control analysis. Currently two tools are available (more are planned to be added in the future):
- Compute Counts for counting how many reads are mapped to each region of interest at the desired level (genes, transcripts, etc.)
- Clustering for obtaining groups of genomic features that share similar coverage profiles